Project Gallery (3)
Sales Data Analysis
Overview
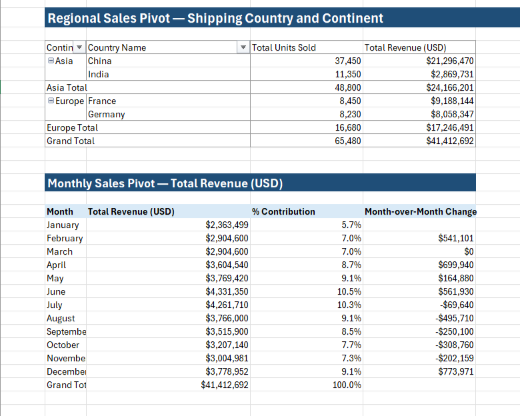
Developed a sales data analysis dashboard as part of a self-directed Microsoft Excel learning project. Cleaned and standardized raw sales data using advanced text functions, calculated revenue metrics, and created Pivot Table reports to analyze sales performance across countries and continents. The project demonstrates practical skills in data transformation, reporting, and spreadsheet automation for business decision-making.
The Challenge
Raw sales data contained inconsistent text formatting and required extensive cleaning before meaningful analysis could be performed. Generating sales summaries across different regions also involved repetitive manual calculations.
The Solution
Applied Excel text functions, including TRIM, LEFT, MID, RIGHT, FIND, and SUBSTITUTE, to standardize the dataset. Calculated sales revenue using Excel formulas and created Pivot Tables to summarize sales performance by country and continent, enabling faster reporting and clearer business insights.
Results
Standardized raw sales data for consistent analysis.
Automated revenue calculations using Excel formulas.
Generated Pivot Table summaries by country and continent.
Improved data consistency through text transformation functions.
Produced structured reports to support data-driven decision making.